What is ApexCharts?
ApexCharts is a modern charting library that helps developers to create beautiful and interactive visualizations for web pages.
It is an free-source project under a dual-license model to support individuals, startups, and commercial products of all sizes.
Built for developers
Integrating visualizations with ApexCharts is as simple as it can get with extensive API docs and 100+ samples ready to be used.
See it in action
Below is a code snippet to show a glimpse of how easy it is to create interactive charts.
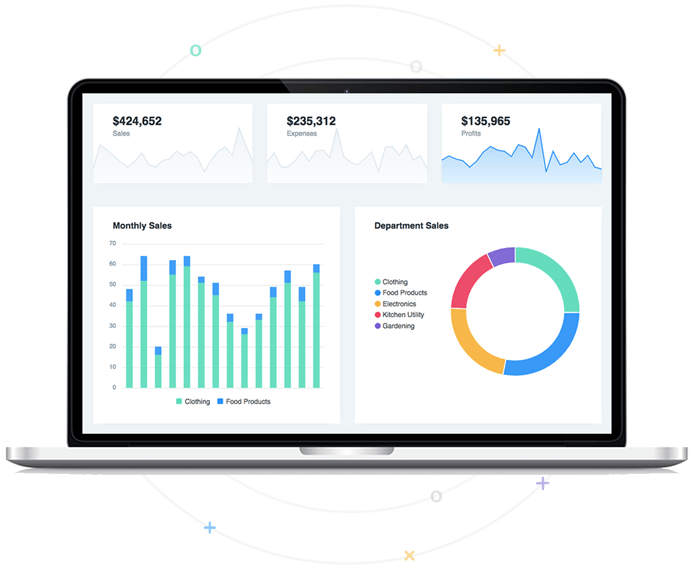
Dashboard Templates
Dashboard is the face of any application and should speak an expressive language.
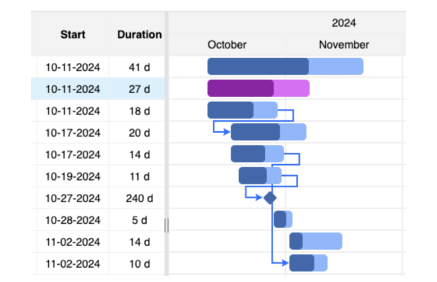
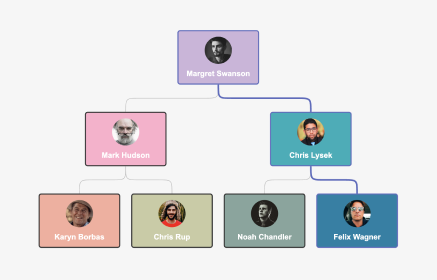
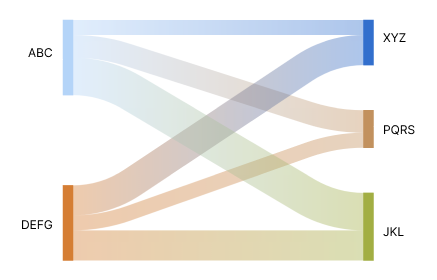
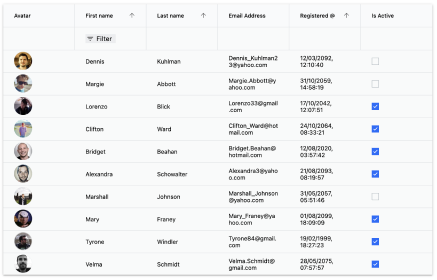
We have developed dashboard templates for you to have a look at the possibilities of ApexCharts.
Follow us and ask more on:
Integrate with popular frameworks
Please wait...