Update Charts from JSON API & AJAX
A guide on how to update the charts from JSON API & AJAX
In many cases, you might not have the data available immediately when rendering a page. Or, you might have to wait for certain user interactions before the data can be fetched. In such cases, it is a good idea to render an empty chart initially and then fetch chart data via AJAX request.
In this tutorial, we will see how to use different methods of fetching data using jQuery/Axios and then calling updateSeries method of ApexCharts.
Sample Data
We will use the sample data from a local JSON file located on the GitHub repo
The sample data will be in the following format:
"data": [
  {
    "x": timestamp,
    "y": value
  },
  .
  .
  {
    "x": timestamp,
    "y": value
  },
]
Draw an empty chart
Initially, we will set up the chart options and render a chart without supplying any data. You can see in the code snippet below that we have provided an empty array in the series property.
var options = {
  chart: {
      height: 350,
      type: 'bar',
  },
  dataLabels: {
      enabled: false
  },
  series: [],
  title: {
      text: 'Ajax Example',
  },
  noData: {
    text: 'Loading...'
  }
}

var chart = new ApexCharts(
  document.querySelector("#chart"),
  options
);

chart.render();
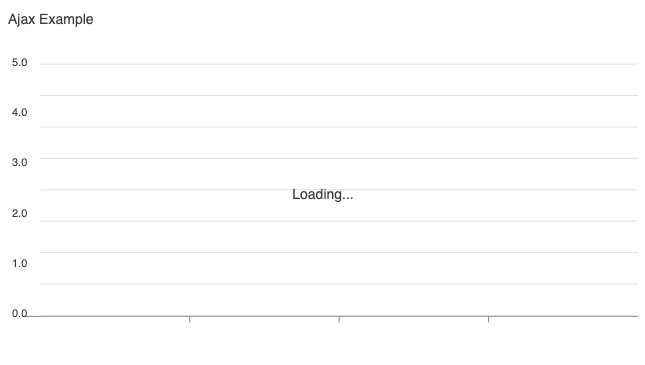
Once you run the above code snippet, you will see an empty chart as shown below with a text Loading... in the center. This text is customizable and can be changed by setting the noData property.

Get data with jQuery.getJSON
We will make an AJAX request by calling the getJSON method of jQuery.
var url = 'http://my-json-server.typicode.com/apexcharts/apexcharts.js/yearly';

$.getJSON(url, function(response) {
  chart.updateSeries([{
    name: 'Sales',
    data: response
  }])
});
The above implementation specifies a success handler in which we get our response from the API. We supply the returned data from the success callback and call the updateSeries() method to update our chart.
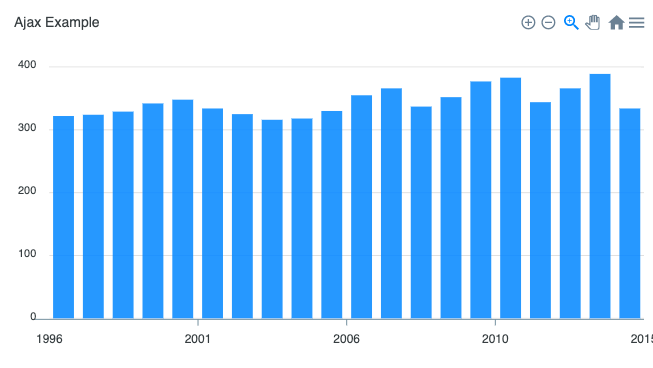
Once the data is fetched from API, you should see the following chart with the new data.

Get data with axios
We will also illustrate making an AJAX request with axios and calling updateSeries after getting the data from API.
var url = 'http://my-json-server.typicode.com/apexcharts/apexcharts.js/yearly';

axios({
  method: 'GET',
  url: url,
}).then(function(response) {
  chart.updateSeries([{
    name: 'Sales',
    data: response.data
  }])
})
When you make a request, Axios returns a promise that will resolve to a response object if successful. The then() callback will receive a response object with the data property. Use this to inject it into the updateSeries() method.
To summarize, in order to create dynamic charts using JSON data, all you need to do is render an empty chart initially and then call the updateSeries method.
View full example
You can view the full example in the samples directory on the GitHub repo.
Reset Password
Enter your email address and we'll send you a link to reset your password.
Back to Login
Please wait...